This post is keeping some notes regarding useful DAX code.
DAX code
DAX, or Data Analysis Expressions, is a collection of functions, operators, and constants that can be used in formulas or expressions to calculate and return one or more values. It is designed to work specifically with Power BI, Power Pivot, and Analysis Services.DAX can introduce the following 2 results:
1.Calculated_Columns
- -Values are calculated based on info from each row of table;
- -Appends static values to each row in a table (new column which increase file size);
- -Primarily used for filtering data in reports;
2.Meatures_Columns
- -Valuese are calcualted based on info from any filters in the report(filter context);
- -No new column is created or added to the file (not increase file size);
- -Primarily used for aggregating values in report visual;
General_Method:
1.adding a new empty table using DAX:
1 | Meature Table = {""} |
2.Performs division and returns the alternate result (or blank) if DIV/0
1 | =DIVIDE(Numerator, Denominator, [AlternateResult]) |
3.check value in a list:
1 | Weekend = IF('Calendar Lookup'[WeekDay] IN {6,7}, "Weekend", "Weekday") |
4.RELATED()
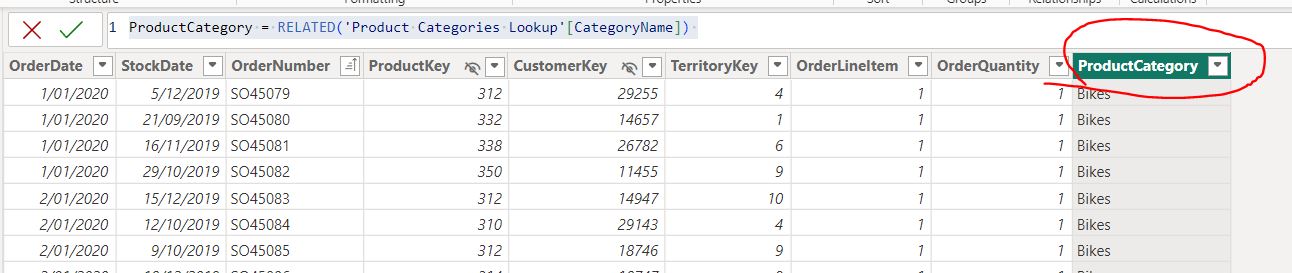
The RELATED function in DAX is used to fetch a related value from another table. It relies on existing relationships between tables to bring in data from a related table into your current context.It can be used to extract other field from another linked table (with many-to-one relatinship) in “many”-side table to get a related column in “one”-side table (it’s good for debugging), but may increase the size of your file. This can go as far as the linked relatinship exists. Please see following example:
1 | ProductCategory = RELATED('Product Categories Lookup'[CategoryName]) |
RELATED() method is also useful in those Iterator (X) Functions such as SUMX, MINX , MAXX , AVERAGEX...
Adding a new column in "Sales Data" table by bringing the corresponding column ("CategoryName") in "Product Categories Lookup" table.
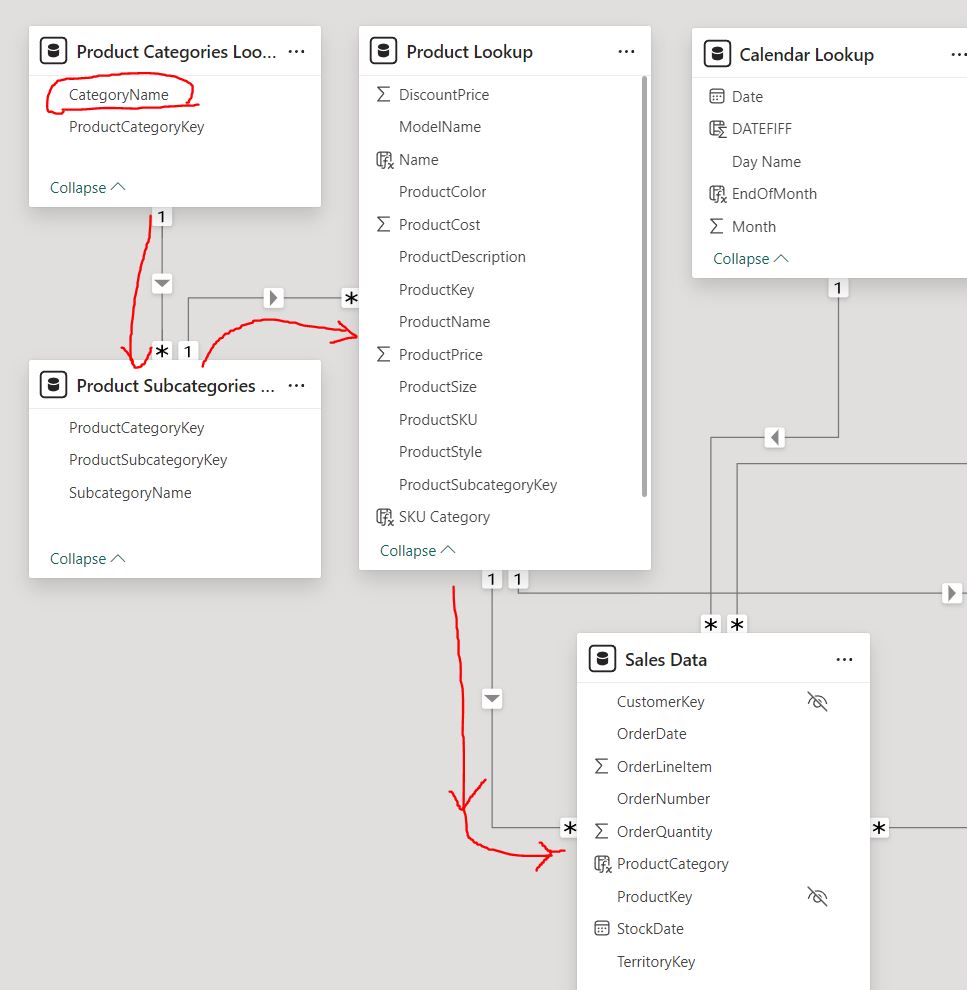
The following chart shows the relationship is passed from “Product Categories Lookup” table to “Product Subcategories Lookup” table and then through the “Product Lookup” table, finally to the “Sales Data” table. That the RELATED() method can directly bring in the column (“CategoryName”) in “Product Categories Lookup” table to “Sales Data” table even there is no directly linked relationship between “Sales Data” table and “Product Categories Lookup” table (as shown in above chart). However this is still can be done due to the indireclty linked relationship via “Product Subcategories Lookup” table and Product Lookup” table:
5.CALCUlATE()
Further to force powerbi to use customized Filter condition defined in this funciton to get corresponding filtered measure values;it Modifies and overrules any competing filter context;1 |
|
Iterator (X) Functions
Loop through each row of a table to apply the the same expressin function first, then apply certain aggregation to the all the results. (has some similarities to the "Apply()" function in Python-Pandas).6.SUMX()
1 |
|
NOTE: SUMX() can also be used to get rolling result, detail pls see 9.2 in the below.
7.DATESYTD()
Get the Fiscal Year Running Total profit (meaning profit was accumulated up to the Fiscal Year end here use 30th June), and reset in next ficial year (The default year end date is December 31):
1 | Profit To Fiscal Year End = CALCULATE([Profit], DATESYTD('Calendar Lookup'[Date], "6-30")) |
To Quarterly end:
1 | Profit To Quarter End = CALCULATE([Profit], DATESQTD('Calendar Lookup'[Date])) |
8.DATEADD()
1 | #Get date 1 month before of current date: |
9.1.DATESINPERIOD("dates", "start_date", "number_of_intervals", "interval_type")
Get 10 days rolling profit:”start_date” is MAX(‘Calendar Lookup’[Date]) and “number_of_intervals” = -10, meaning to start from latest date and working backwards and for each interval using the previous 10 days as rolling period, to sum up the value.
1 |
|
9.2.SUMX("table", "expression") to get rolling result
Another way to get rolling profit using Iterate function: following will get the same result as the above function.1 | Profit (XFunction Rolling 10 days) = SUMX(DATESINPERIOD('Calendar Lookup'[Date], MAX('Calendar Lookup'[Date]), -10, DAY), [Profit]) |
Explain: how this is fit the SUMX(“table”, “expression”):
1.”table” Argument:
In this case, the “table” argument is provided by:
DATESINPERIOD(‘Calendar Lookup’[Date], MAX(‘Calendar Lookup’[Date]), -10, DAY)
The DATESINPERIOD function generates a table of dates that represents the last 10 days, counting backward from the maximum date in the current filter context.
This table is essentially a list of date values for the last 10 days.
2.”expression” Argument:
The “expression” part is [Profit].
This expression is evaluated for each row (each date) in the table generated by DATESINPERIOD.
Here, [Profit] represents the measure or column that calculates the profit for each specific date.
3.How SUMX Processes These Arguments:
SUMX iterates over each row in the table of dates generated by DATESINPERIOD.
For each date in that table, it evaluates the [Profit] expression, summing up the profit values for each of the last 10 days.
The result is a single value that represents the total profit over the rolling 10-day period.
In essence, the function effectively creates (slide) many different 10-day window tables as it evaluates across different dates, with SUMX calculating the profit for each of these sliding windows.
10.AVERAGEX("table", "expression") to get moving average (rolling average or running average)
Using the above same mindset, we can get moving average say 7 days moving average profit:1 | Profit (Weekly Rolling Avg) = |