This post is trying to explain the concepts of Filter Context and Flow.
Flow of Filter Context
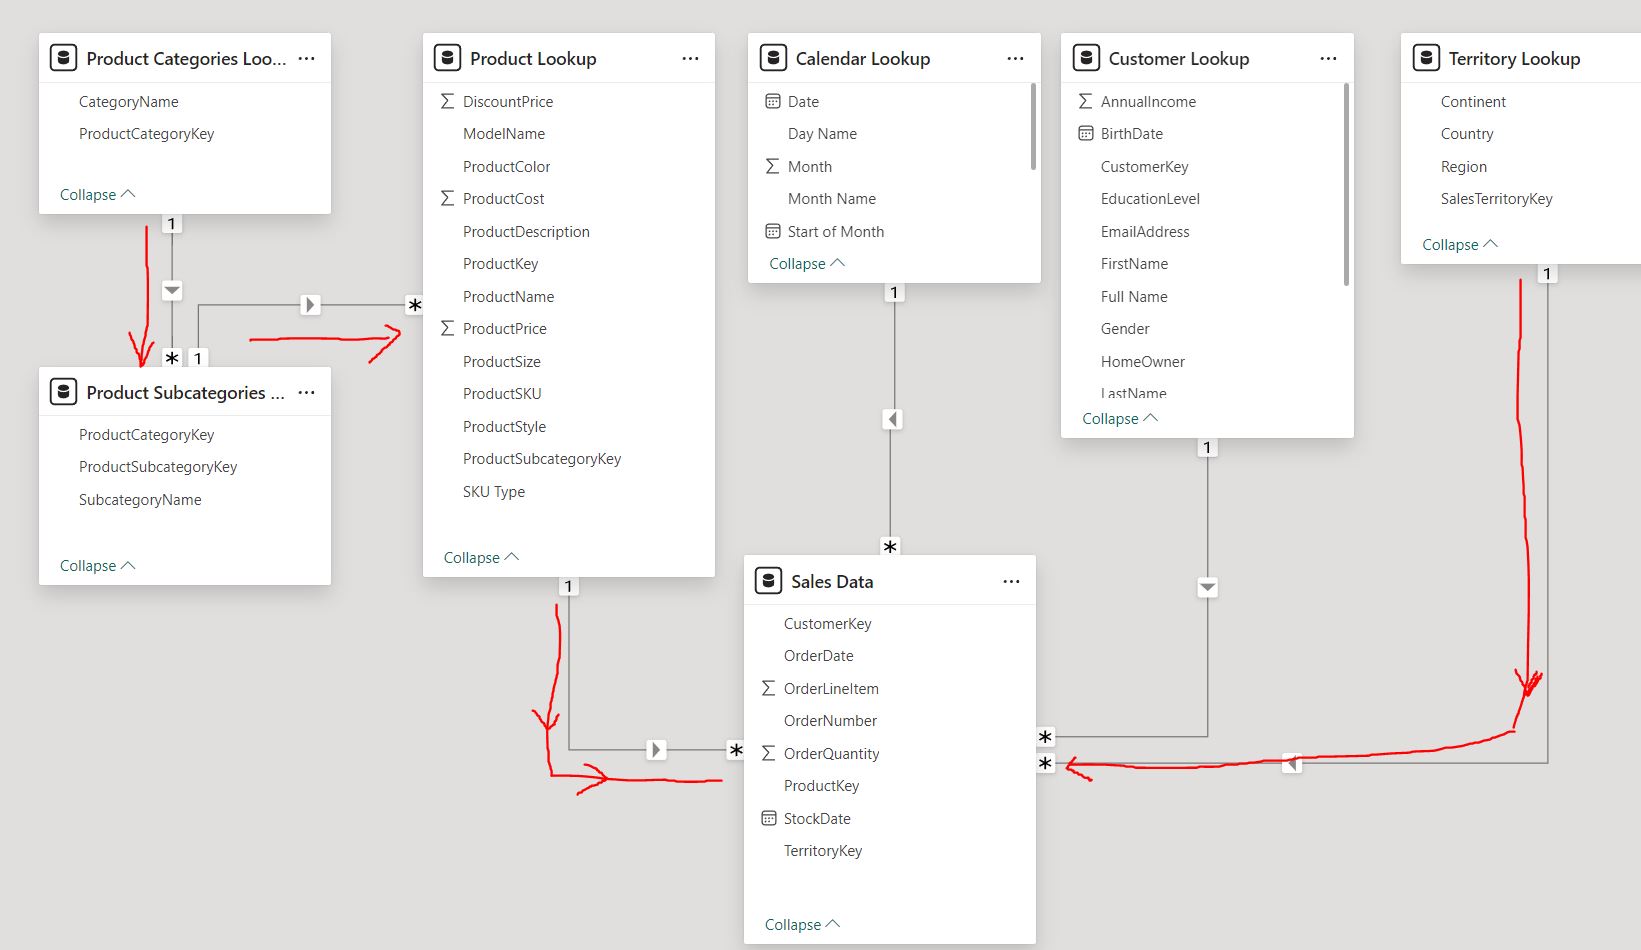
The flow of filter context describes how filters are applied and propagate through relationships in a data model. When a filter is applied to one table, it can affect other tables through established relationships, based on the direction and type of relationship (one-to-many, many-to-one, bidirectional).S1 - Understanding the following models’ flow of relationships:
1.The flow direciton from the one side (1) of the relationship to the many side (*).
2.The following Red arrows show the filter direction, when filter a table that filter context is passed to
any related "downstream" tables, following the arrow's direction.
3.Filter context CANNOT flow "upstream".
Using the following two tables, we can create a summarized table. For example, we aim to generate summarized sales data of products for each continent, categorized by color.
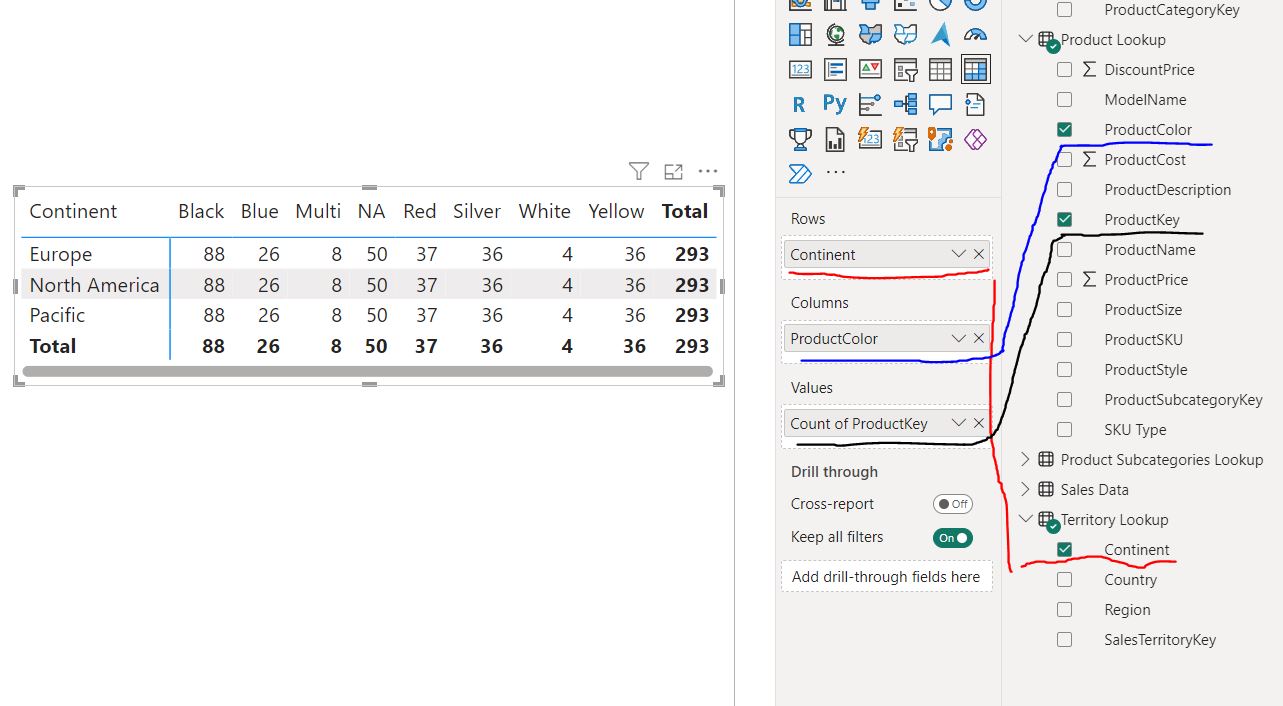
Example of invalide Flow of Filter Context which produces incorrect result:
S2 - If valiate this relationships, then the following metrix tables are not correct, eventually you would result in repeated grant sum number for each continent.
The reason for this error lies in the incorrect filter flow among the “Territory Lookup”, “Sales Data”, and “Product Lookup” tables. Please refer to the above chart (models’ flow of relationships) to see that the filter flow can only move downstream from “Territory Lookup” to “Sales Data”. It cannot move upstream to “Product Lookup” via “Sales Data,” as the filter flow direction (the dark arrow) is reversed in this example, even though those tables have a connected relationship.
Specifically, the lookup values (filter values) are “Rows” from the “Continent” column of the “Territory Lookup” table and “Columns” from the “ProductColor” column of the “Product Lookup” table. However, the values also derive from the count of “ProductKey” in the “Product Lookup” table. This filter flow is incorrect because the filter context can only follow the downstream direction from the “Territory Lookup” table to the “Sales Data” table. It cannot pass upstream to the “Product Lookup” table, as illustrated in the modeling chart
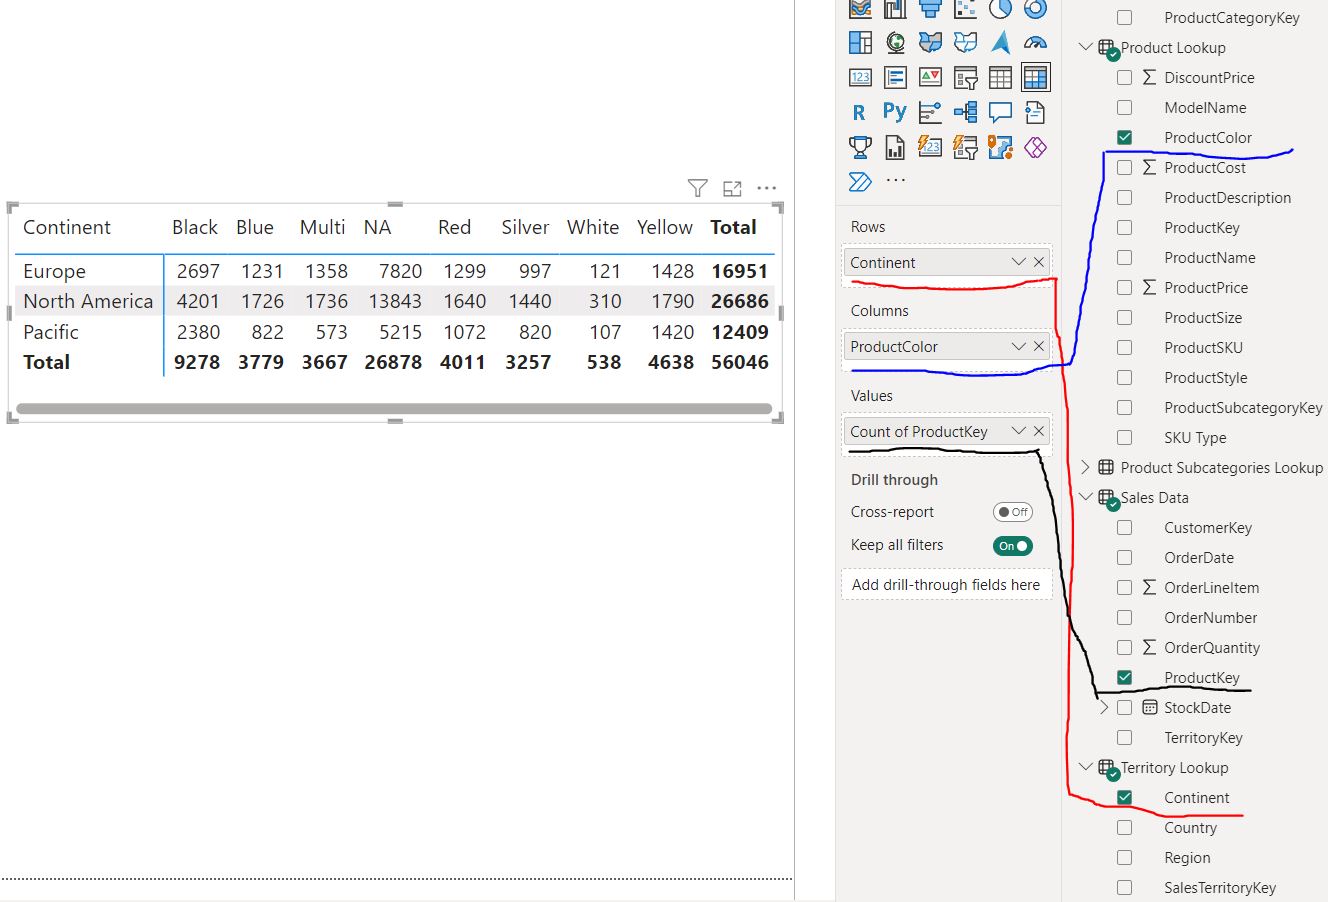
Example of valide Flow of Filter Context to produce correct result:
S3 - The following metrix table is correct which follows the correct flow of filter context:
The reason this is correct is due to the fact that the lookup values (filter values) are “Rows” from the “Continent” column of the “Territory Lookup” table and “Columns” from the “ProductColor” column of the “Product Lookup” table. The values are derived from the count of “ProductKey” in the “Sales Data” table. This filter flow is correct because the filter context follows two downstream directions: one from the “Territory Lookup” table to the “Sales Data” table and the other from the “Product Lookup” table to the “Sales Data” table, as illustrated in the first modeling chart.
However the above issue in Example 1 (of invalide Flow of Filter Context) can be resloved by enabling bidirectional cross-filter (shown in following image), which however should be used with caution.:
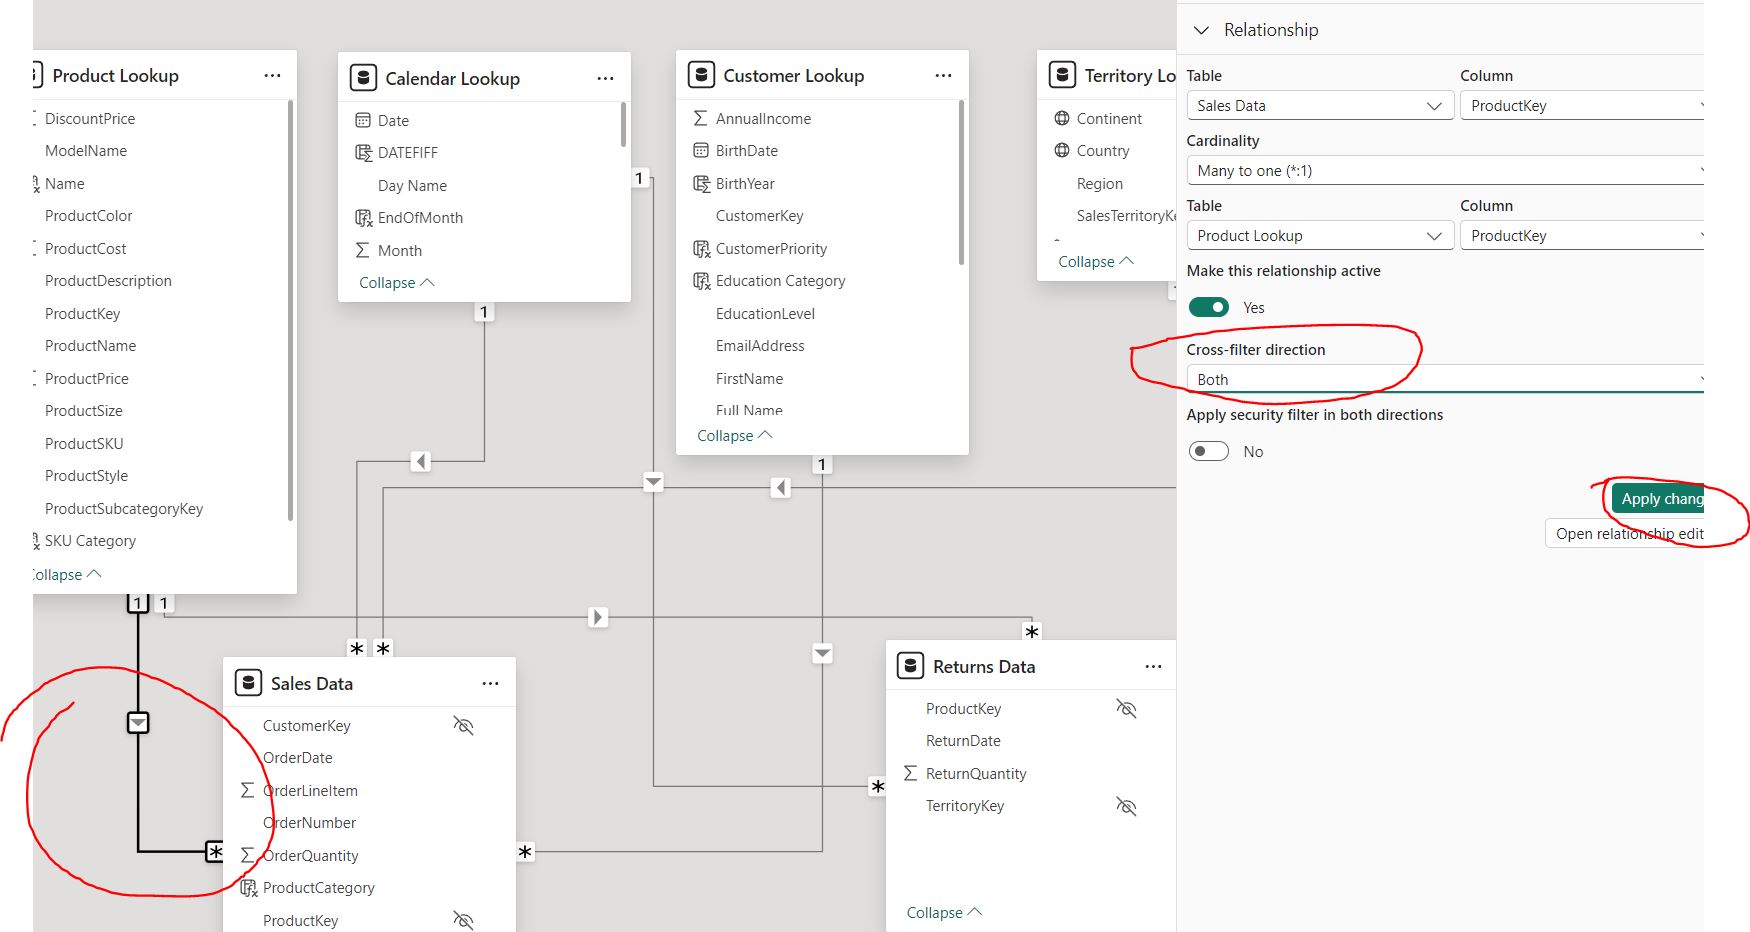
Bidirectional filtering is powerful, but it can introduce complexity in your data model. This could lead to performance issues, especially with large datasets, due to more intensive calculations. It can also make the model harder to understand and debug if there are issues with the filtering logic. Thus, try avoid bidirectional as much as possible.
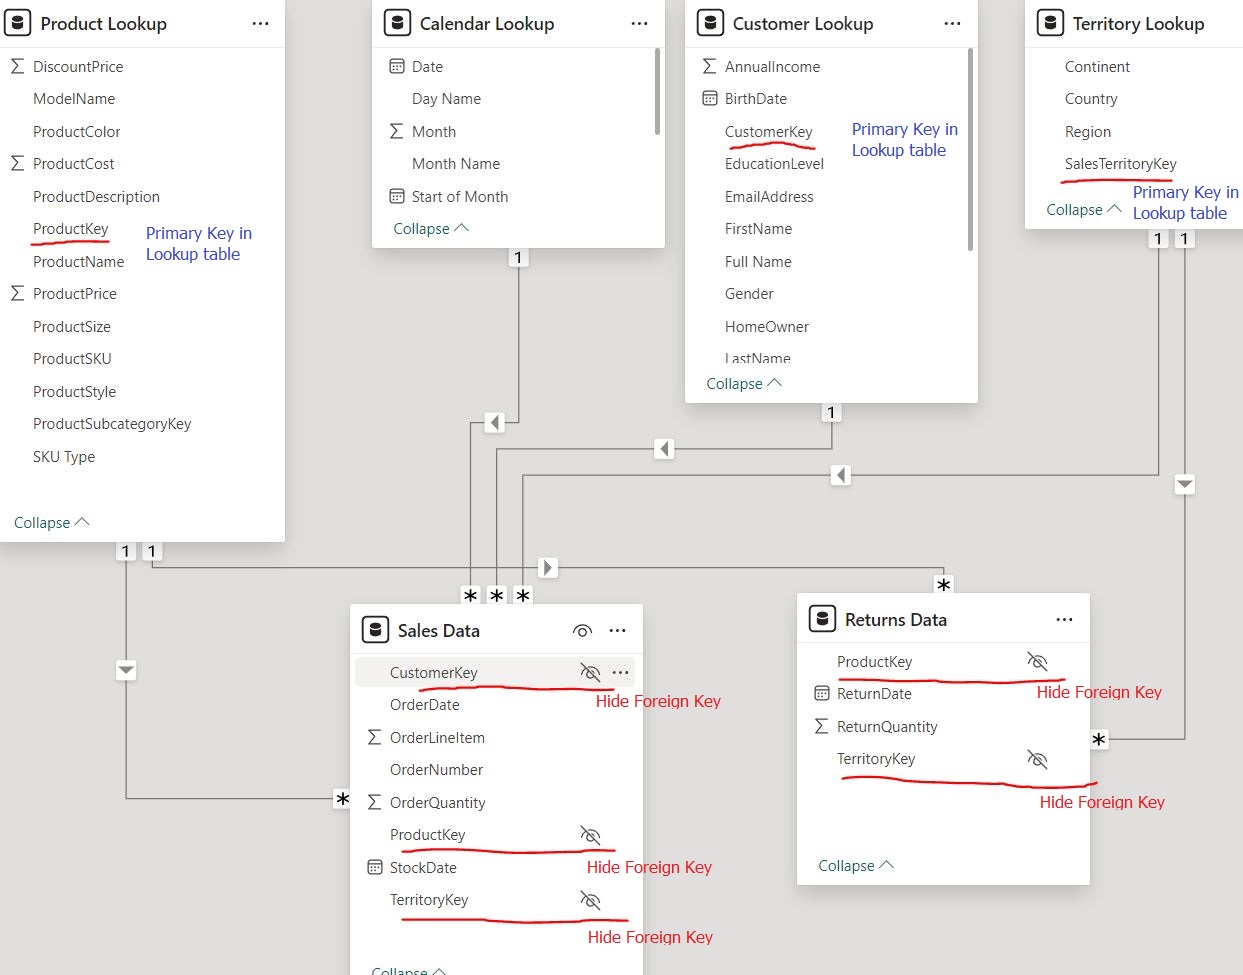
Best Practice regarding keys in the table
In addition, it is always a good idea to hide the foreign keys in the fact tables and use only primary keys in the lookup (Dimension) tables to query the data.:
Reasons:
1.Cleaner Data Model: It simplifies the data model, making it easier to read and understand.
2.Prevents Confusion: Users won’t mistakenly use foreign keys in their analyses, which could lead to incorrect results.
3.Focus on Measures: Keeps users focused on the measures and attributes that are meant for reporting and analysis.
Overall, it makes the data model more intuitive and less prone to user errors.
Example: