Throughout my career in finance, I’ve frequently encountered discussions and readings about seasonal patterns in the U.S. equity market. Consequently, I’ve been inspired to conduct my own analysis to determine if these patterns remain relevant today. This blog delves into the application of data analysis technologies, including Python, Pandas, and Jupyter Notebook, to investigate potential seasonal patterns in the stock market, such as the ‘Sell in May and go away, but remember to come back in September’ phenomenon. For the detailed project, please refer to the link on GitHub.
The saying ‘Sell in May and go away, but remember to come back in September’ is a well-known financial proverb. It suggests that the market’s performance is typically weaker in the six-month period between May and October. To test the validity of this maxim, I analyzed the price data of IVV.US (iShares Core S&P 500 ETF) from 2000 to 2024. This ETF closely tracks the investment results of the S&P 500 index, composed of large-capitalization U.S. equities.
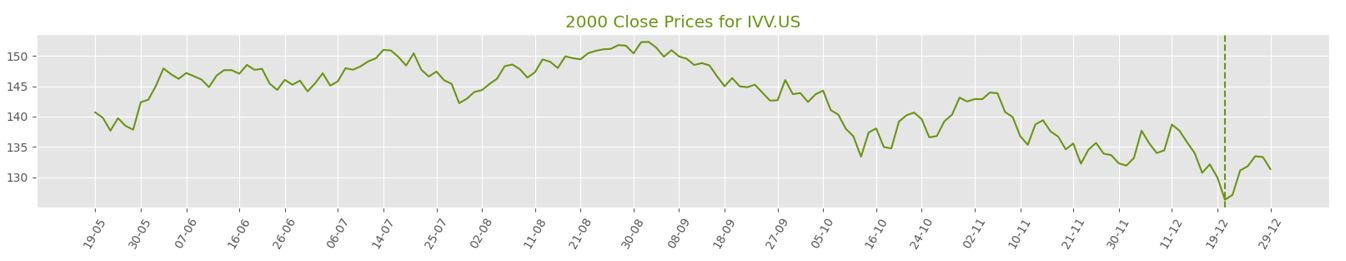
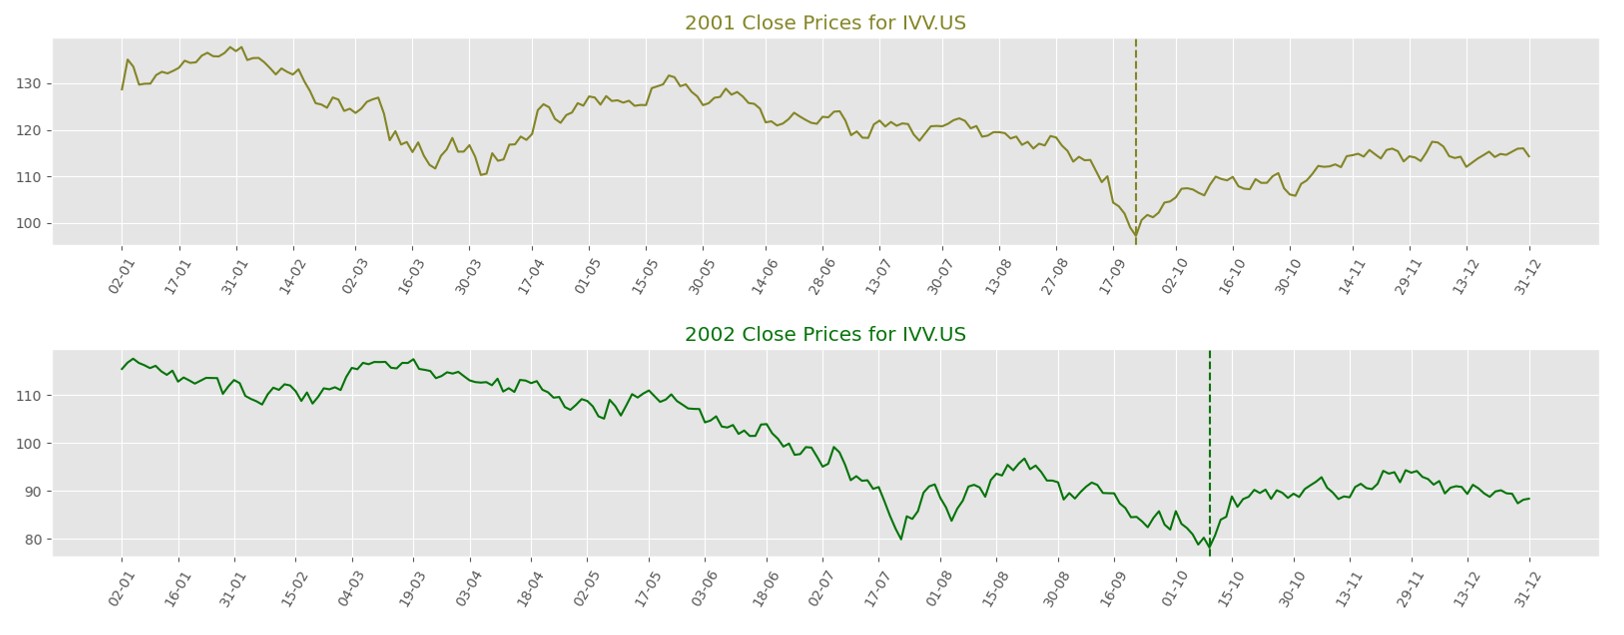
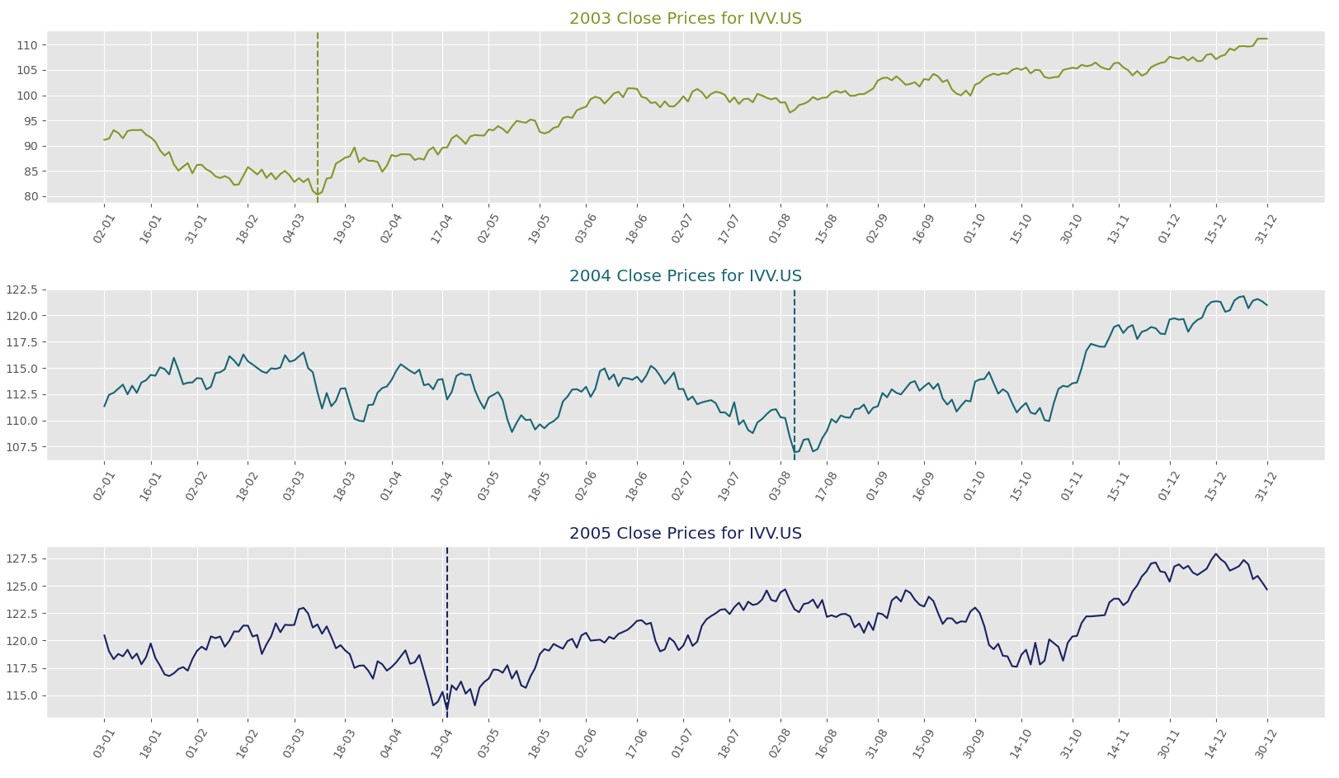
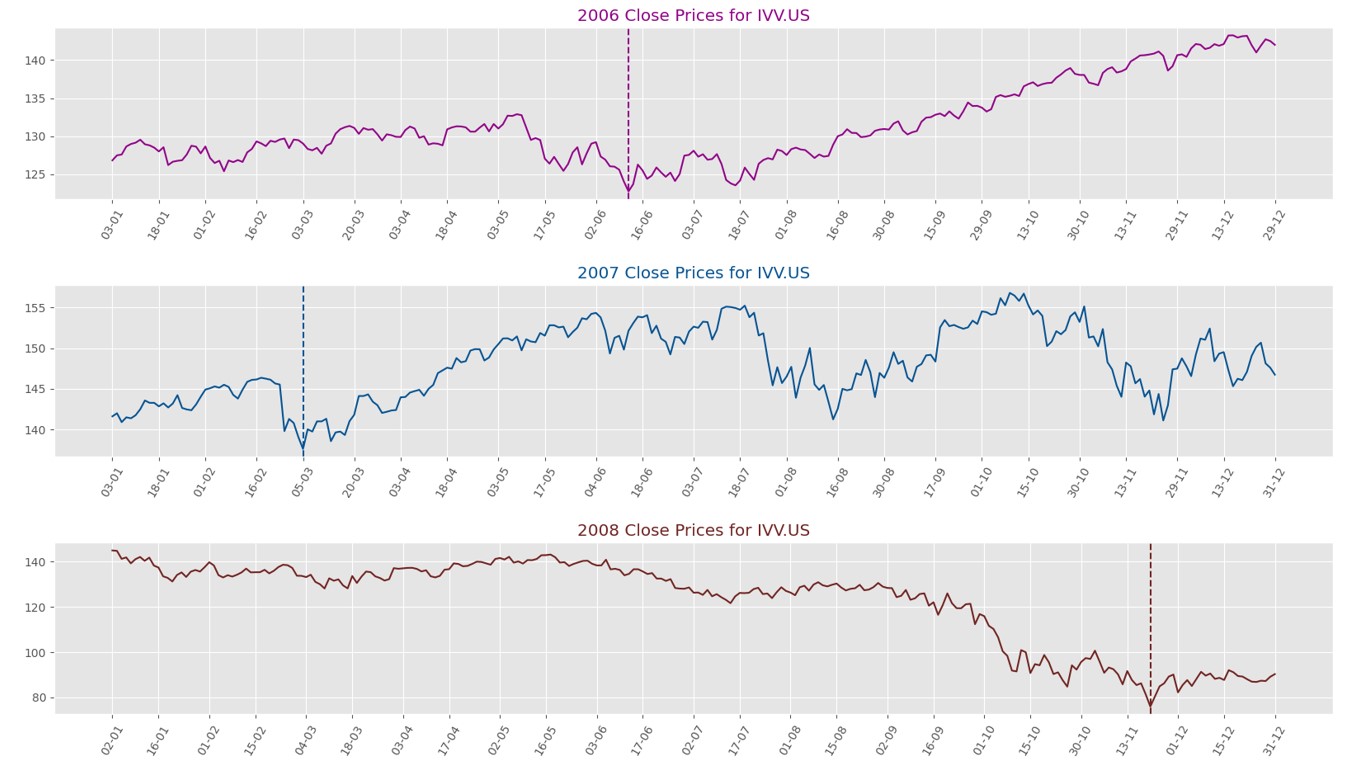
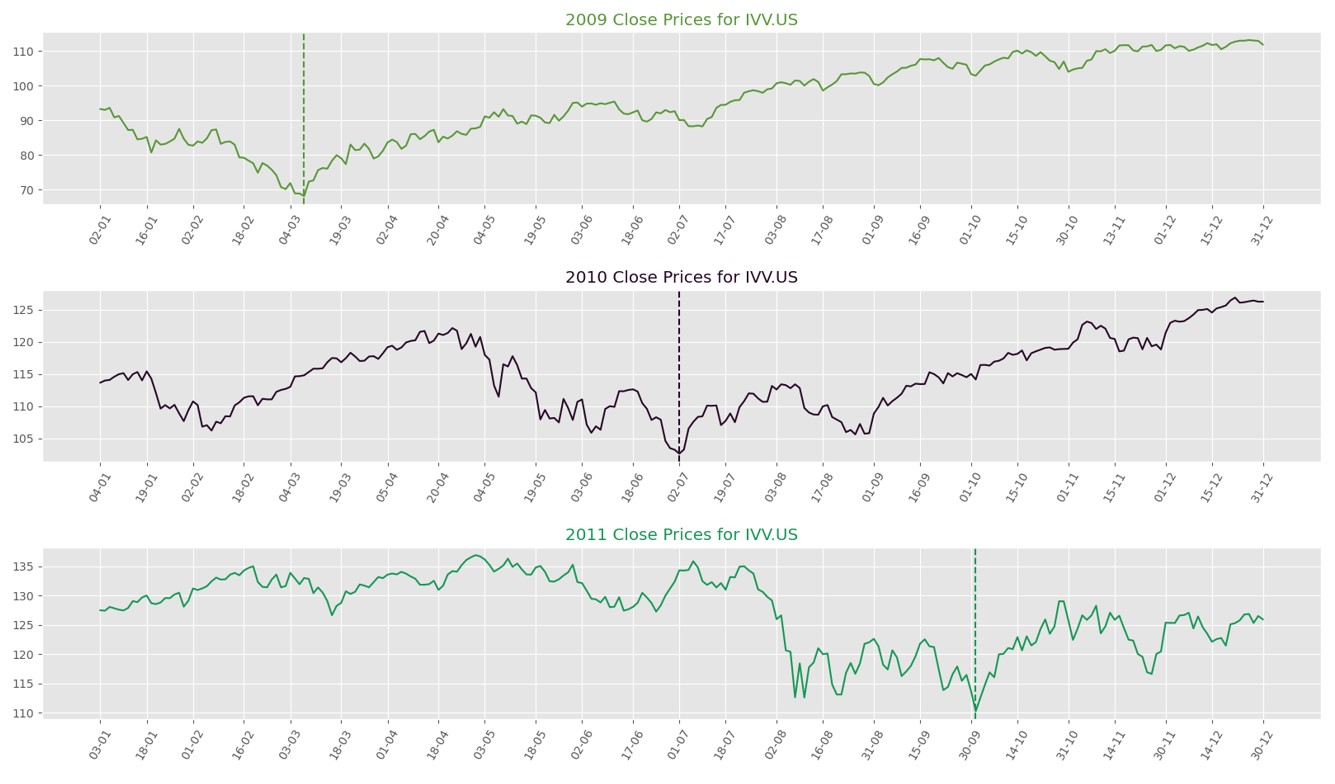
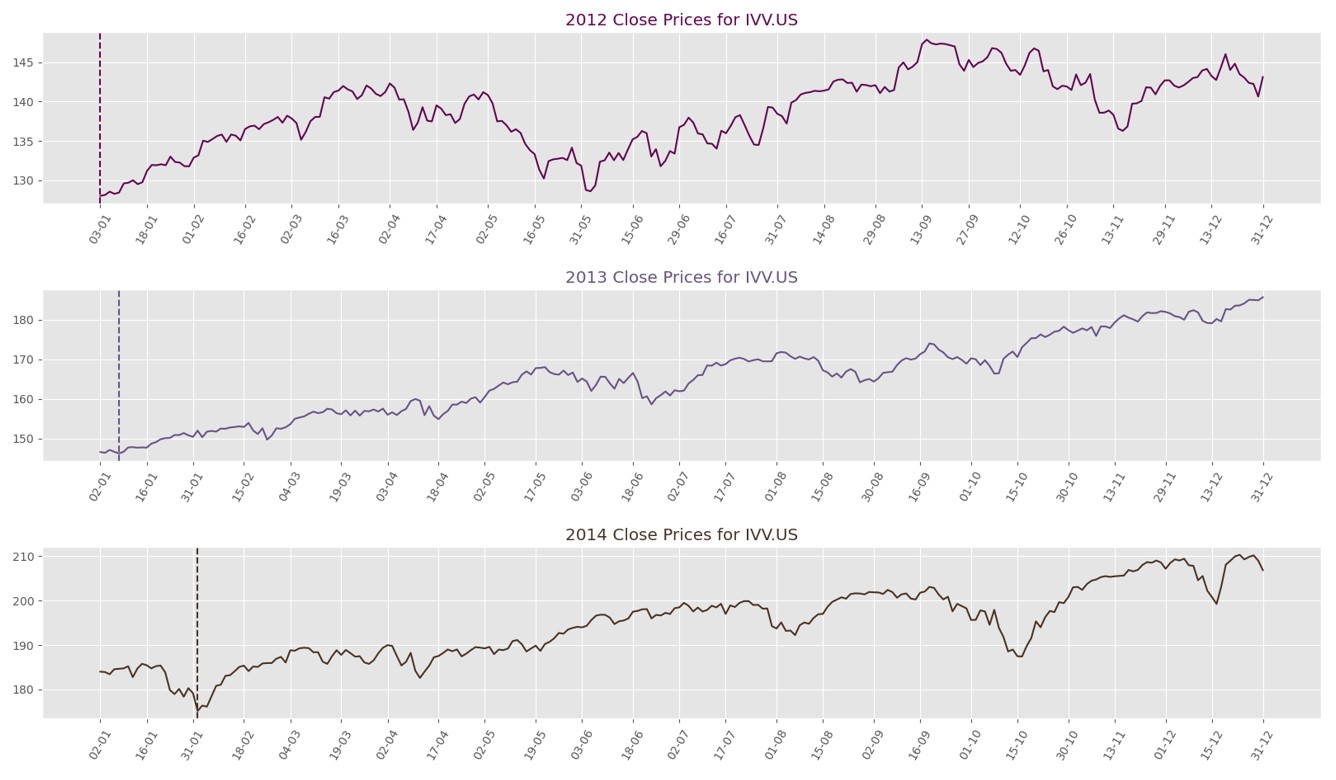
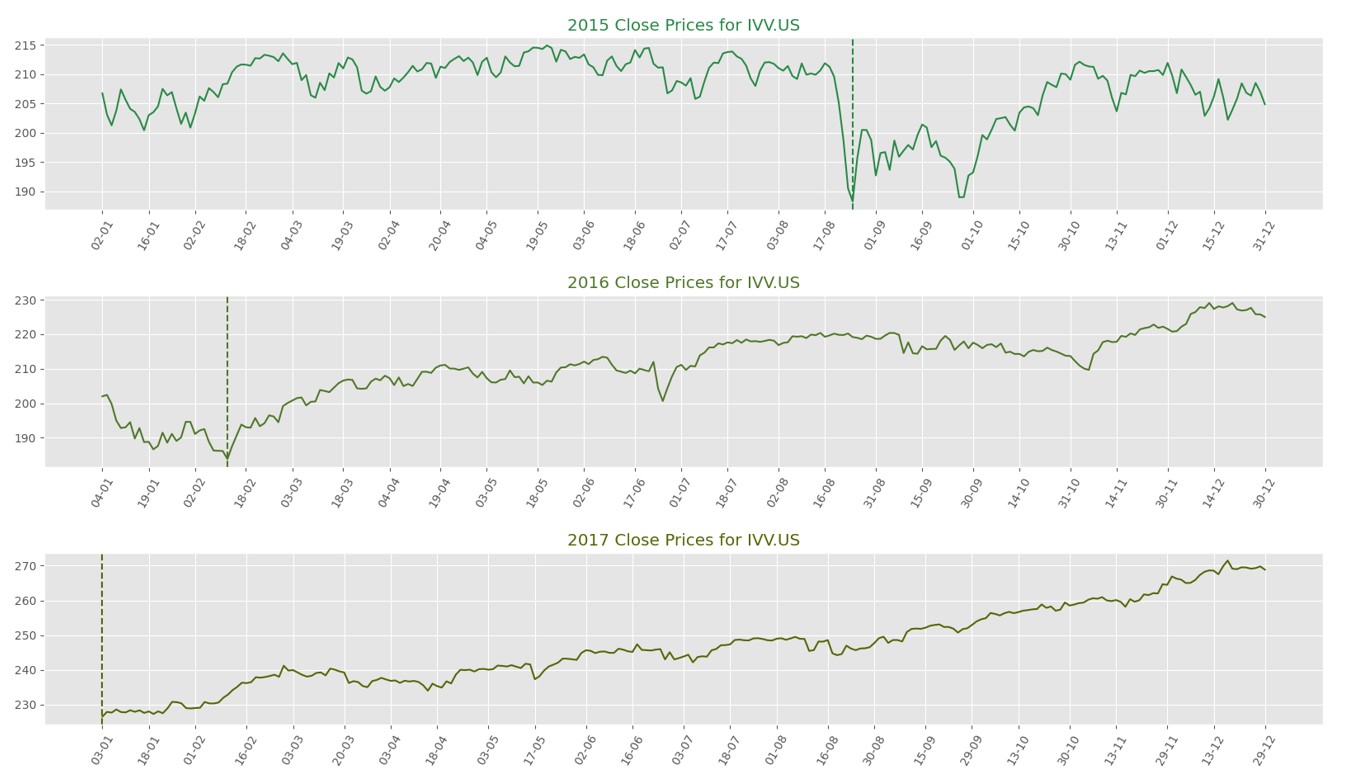
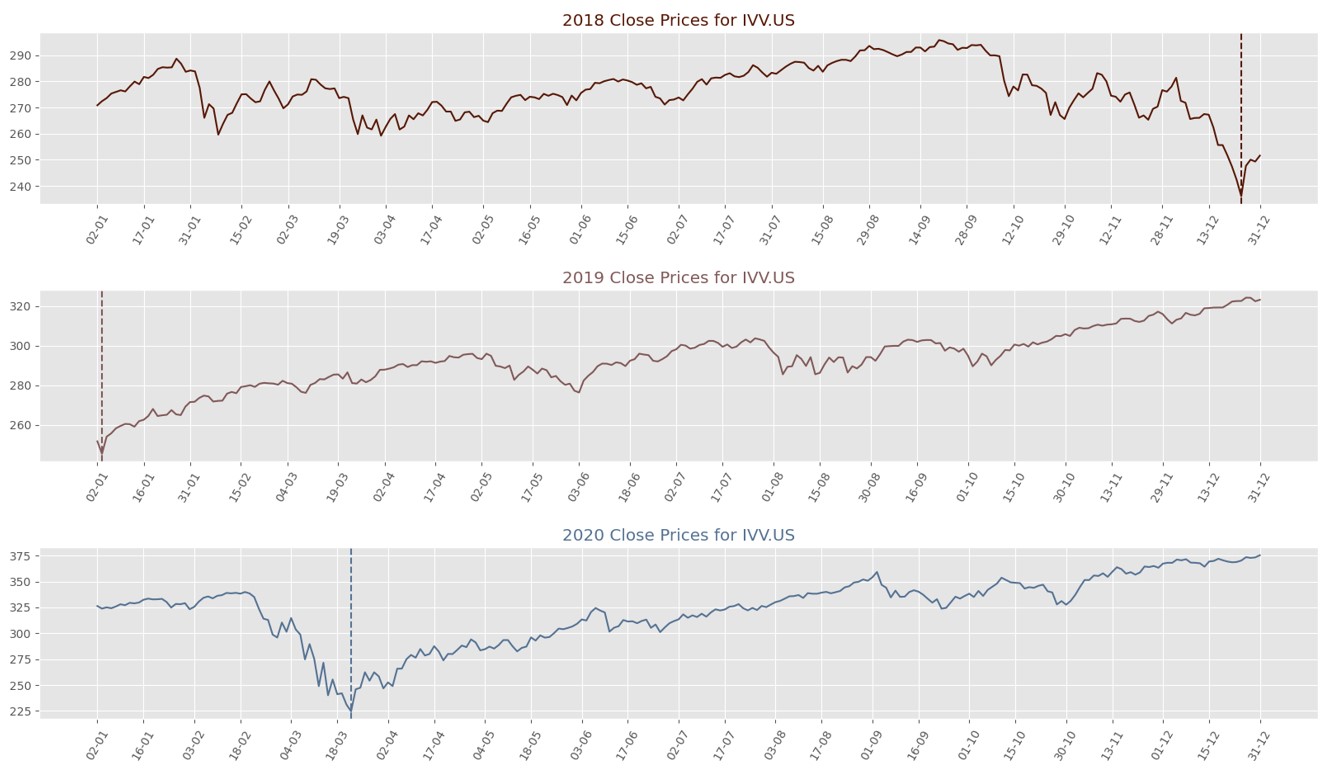
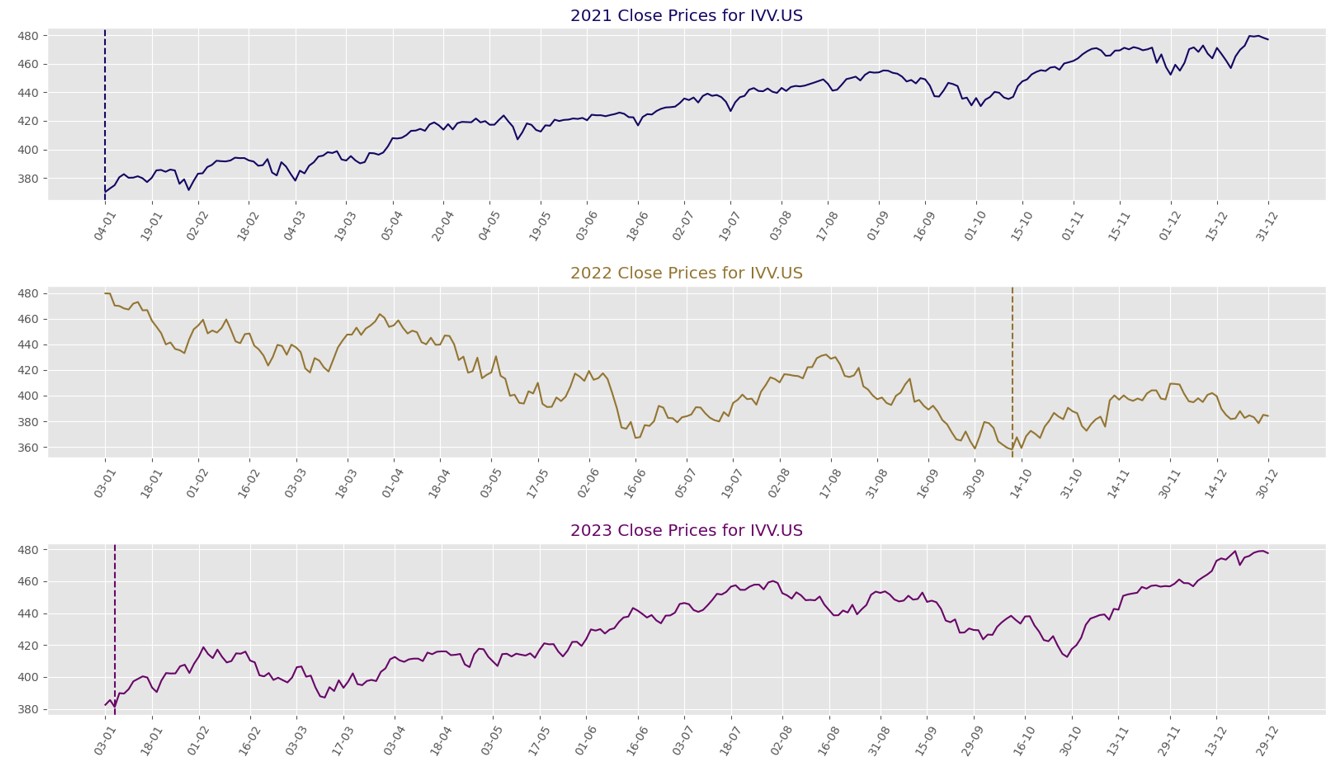
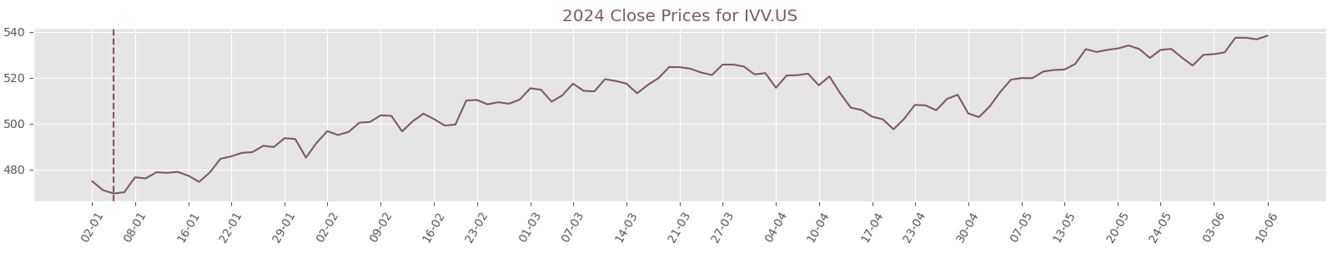
Close prices for each year from 2000 to 2024
NOTE: The dotted vertical line indicates the lowest price of that year. (IVV started trading on May 2000)
Trading Strategies Assumptions:
If I adopted the following different strategies, buying in September of the current year and selling in different months (e.g., Jan, Feb, Mar, Apr, May, Jun, Jul, Aug) of the next year, e.g. I traded 1 unit of IVV each year from 2000 to 2024 and calculated the total profit for each of the following strategies. Considering the length of this article, I only listed 3 main strategies (Jan, May, Aug) for your review. (see github for more details if you are interested in the full)
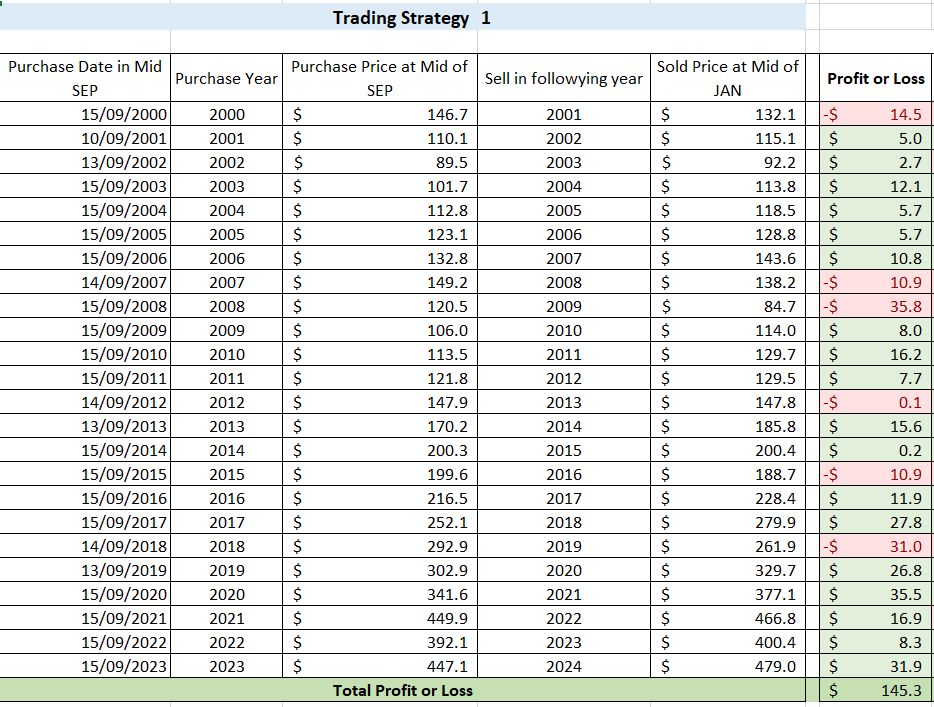
Strategy 1:
Year 1: Purchase 1 unit of IVV in mid-September 2000 at the price of $146.7 and hold it until mid-January of the following year (2001), then sell it at the price of $132.1. You would have a loss of $14.5;
Year 2: Stay out of the market until mid-September 2001, then reinvest in 1 unit of IVV at a price of $110.1. Hold this until mid-January of the next year (2002) and sell it at the price of $115.1. You would have a profit of $5.0;
Repeat this process annually from 2000 to 2024. See detailed breakdown table, after 24 years doing this repeated action, you would have a total profit of $145.3. (without considering transaction costs and CGT).
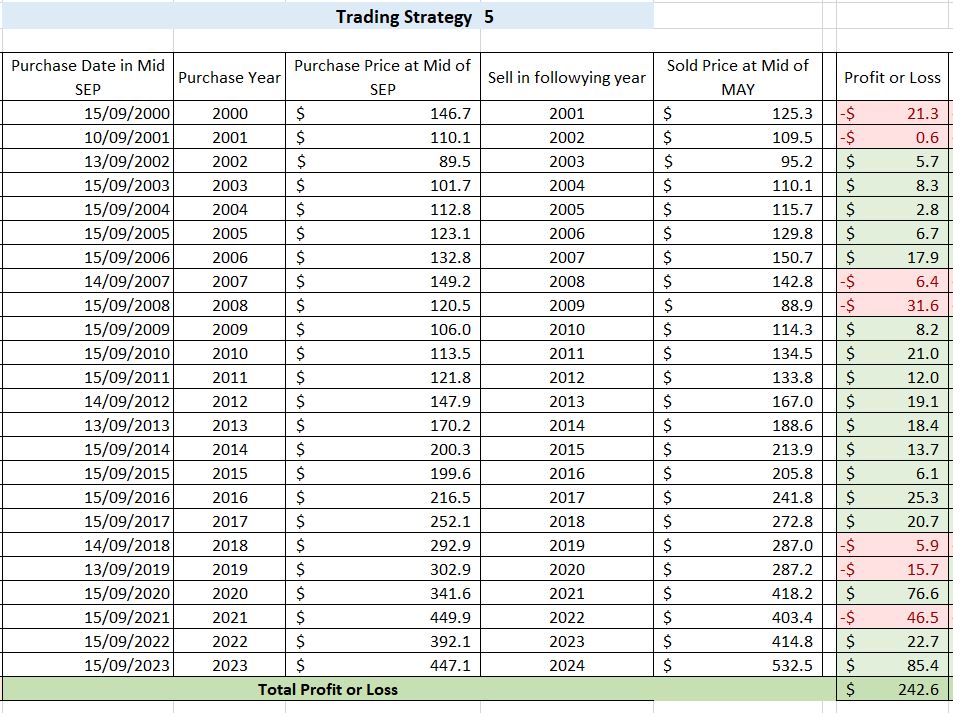
Strategy 5:
Year 1: Purchase 1 unit of IVV in mid-September 2000 at the price of $146.7 and hold it until mid-January of the following year (2001), then sell it at the price of $125.3. You would have a loss of $21.3;
Year 2: Stay out of the market until mid-September 2001, then reinvest in 1 unit of IVV at a price of $110.1. Hold this until mid-January of the next year (2002) and sell it at the price of $109.5. You would have a loss of $0.6;
Repeat this process annually from 2000 to 2024. See detailed breakdown table, after 24 years doing this repeated action, you would have a total profit of $242.6. (without considering transaction costs and CGT).
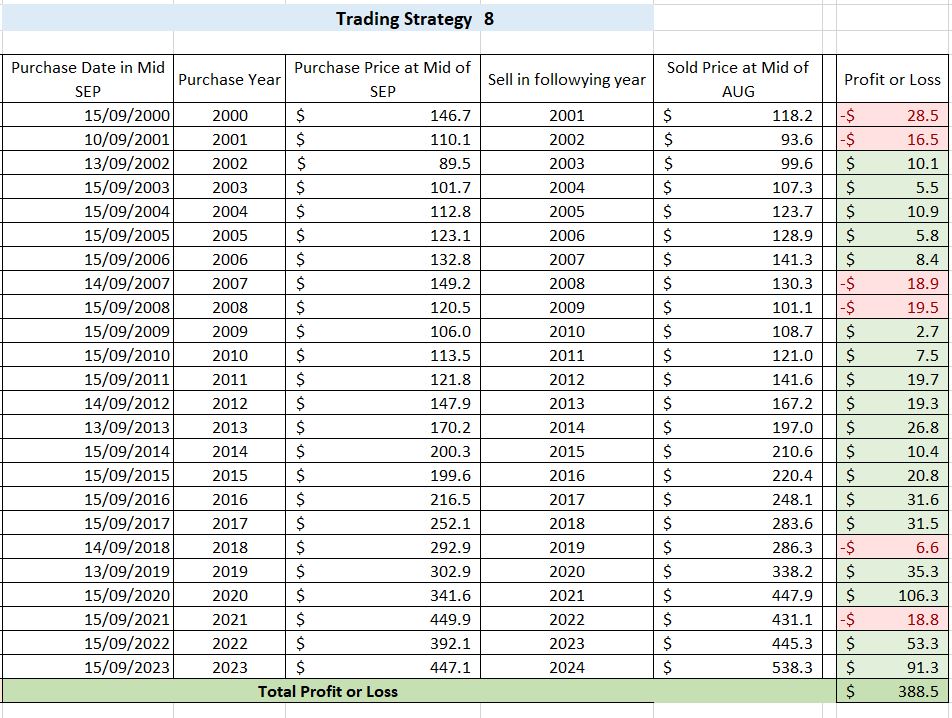
Strategy 8:
Year 1: Purchase 1 unit of IVV in mid-September 2000 at the price of $146.7 and hold it until mid-January of the following year (2001), then sell it at the price of $118.2. You would have a loss of $28.5;
Year 2: Stay out of the market until mid-September 2001, then reinvest in 1 unit of IVV at a price of $110.1. Hold this until mid-January of the next year (2002) and sell it at the price of $93.6. You would have a loss of $16.5;
Repeat this process annually from 2000 to 2024. See detailed breakdown table, after 24 years doing this repeated action, you would have a total profit of $388.5. (without considering transaction costs and CGT).
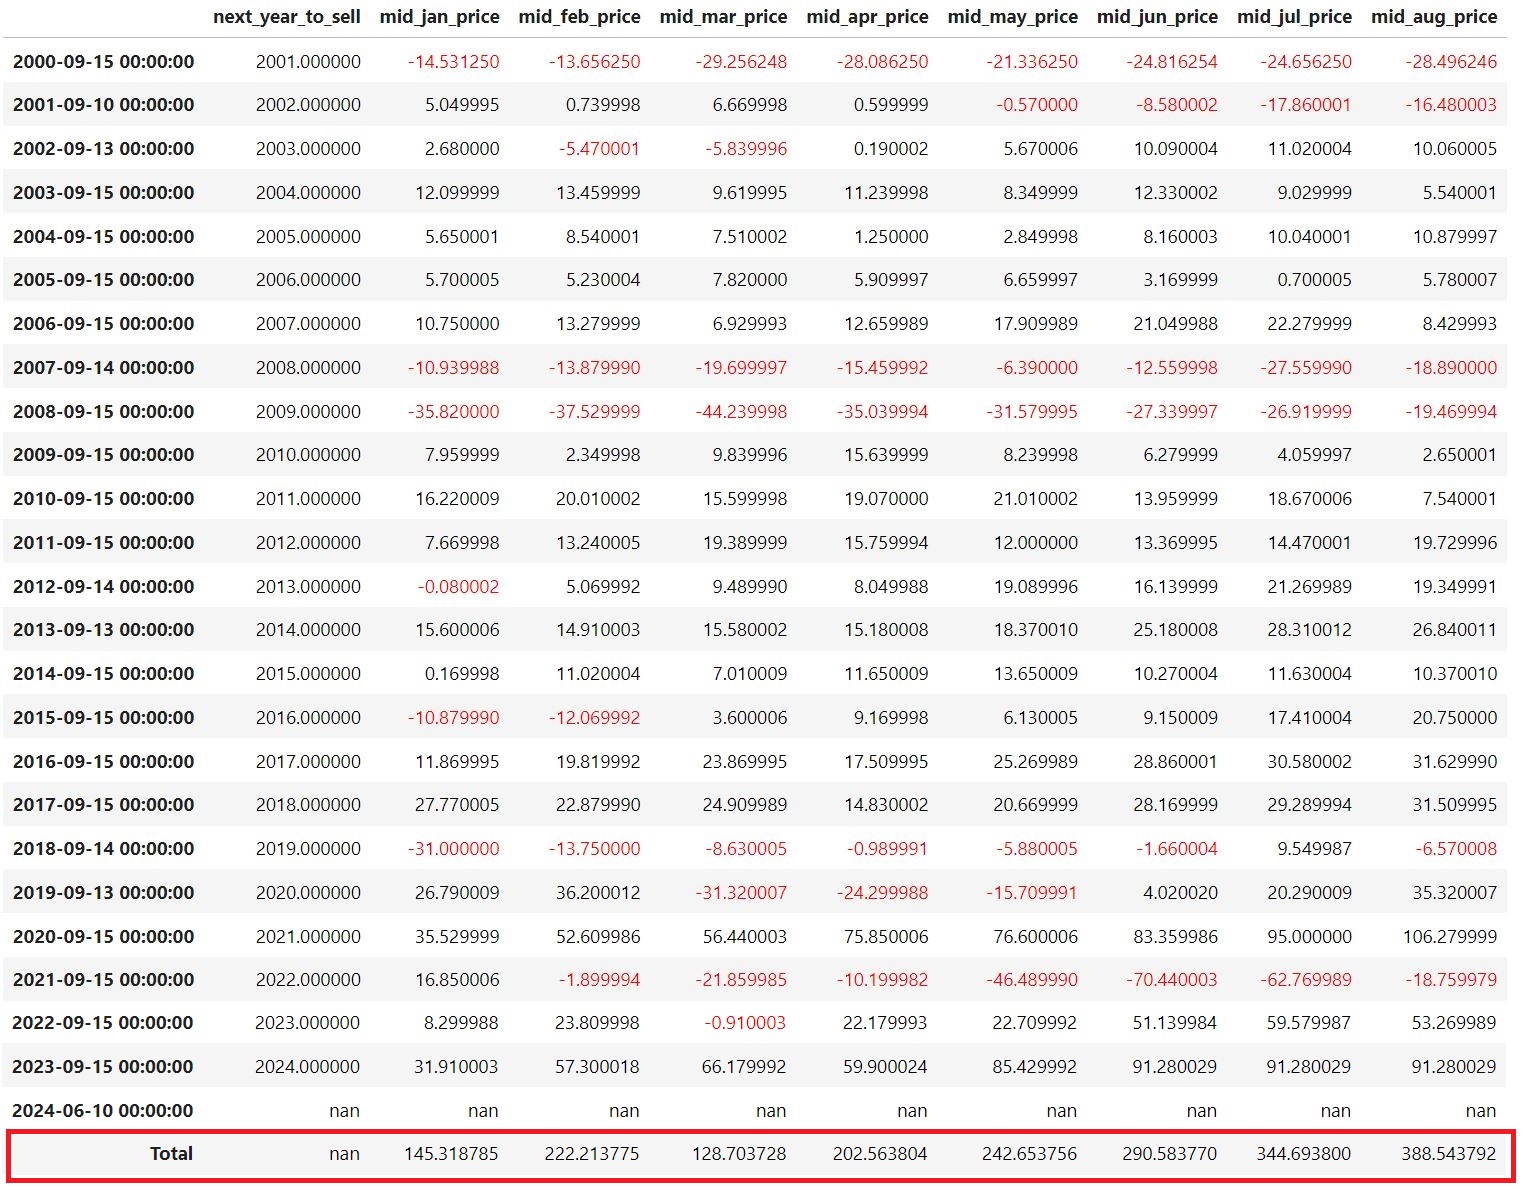
Presented below is the final summary table that illustrates the price differences for each trading interval. This table displays the differences between the prices in January, February, March, April, May, June, July, and August (from 2001 to 2024) and their corresponding prices in September of the preceding year (from 2000 to 2023):
Seasonal Patterns Finding
After summarizing all of the startegies in above table, I obtain the following results (without considering transaction costs and capital gains tax): 1.The sum of the column ‘mid_jan_price’ is $145.31. This means that if you adopt the strategy of
“buy in September of the current year, sell in January of the next year,” with trading 1 unit of IVV each year from 2000 to 2024, your total profit would be $145.31.
2.The sum of the column ‘mid_feb_price’ is $222.21. This means that if you adopt the strategy of
“buy in September of the current year, sell in February of the next year,” with trading 1 unit of IVV each year from 2000 to 2024, your total profit would be $222.21.
3.The sum of the column ‘mid_mar_price’ is $128.70. This means that if you adopt the strategy of
“buy in September of the current year, sell in March of the next year,” with trading 1 unit of IVV each year from 2000 to 2024, your total profit would be $128.70.
4.The sum of the column ‘mid_apr_price’ is $202.56. This means that if you adopt the strategy of
“buy in September of the current year, sell in April of the next year,” with trading 1 unit of IVV each year from 2000 to 2024,
your total profit would be $202.56.
5.The sum of the column ‘mid_may_price’ is $242.65. This means that if you adopt the strategy of
“buy in September of the current year, sell in May of the next year,” with trading 1 unit of IVV each year from 2000 to 2024,
your total profit would be $242.65.
6.The sum of the column ‘mid_jun_price’ is $290.58. This means that if you adopt the strategy of
“buy in September of the current year, sell in June of the next year,” with trading 1 unit of IVV each year from 2000 to 2024,
your total profit would be $290.58.
7.The sum of the column ‘mid_jul_price’ is $344.69. This means that if you adopt the strategy of
“buy in September of the current year, sell in July of the next year,” with trading 1 unit of IVV each year from 2000 to 2024,
your total profit would be $344.69.
8.The sum of the column ‘mid_aug_price’ is $388.54. This means that if you adopt the strategy of
“buy in September of the current year, sell in Aug of the next year,” with trading 1 unit of IVV each year from 2000 to 2024,
your total profit would be $388.54.
In summary, based on historical data, you can still profit by simply following “buy in September of the current year, and sell in May of the next year.”
However, this is not the most optimal strategy. The data indicates that the longer you hold, the more profit you can make.
Frequent trading erodes your profit due to higher brokerage costs and CGT. As a result, long-term passive holders of IVV tend to make more money. For instance, if you buy 1 unit of IVV in mid-September 2000 at a price of $146.65 and hold it until June 10, 2024, when the price is $538.33, you would end up with a profit of $391.68. This profit is higher than any of the above trading strategies, and you will incur significantly lower transaction costs and capital gains tax.
Additional Findings for Long-Term Investors
In addition, from the charts I can also find interesting findings in long-term trend over 24 Years:
Significant Fluctuations: Most years exhibit significant price fluctuations, with only 6 years showing steady upward trends without significant fluctuations.
Opportunities for Traders and Investors: The remaining years have seen dramatic ups and downs during certain months, creating opportunities for both short-term traders and long-term investors.
Following table shows First Quarter Advantage: Long-term investors should note that the first quarter (January, February, March) often presents the lowest entry point, with a combined 48% chance.
Second Entry Point: Another entry point may emerge during August, September, or October, with a 24% chance.
Table of months exprienced the lowest price of that year:
meaning over the past 25 years of history, there are 7 years out of 25 years experienced that January has the lowest price of that year.Interestingly, there is no May in this table: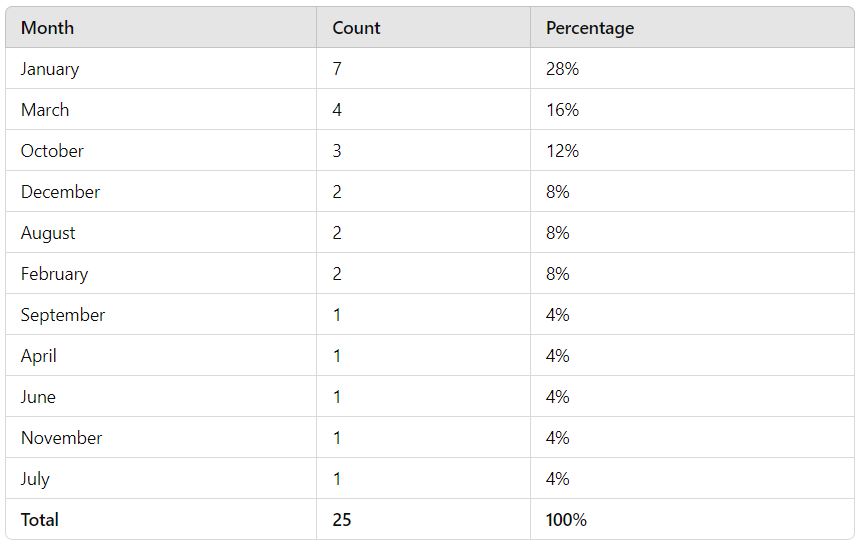
It’s important to note that past performance is not indicative of future results, and all investment strategies should be considered carefully and in consultation with your financial professionals.