To start, I’m using both of these tools and thoroughly enjoying them. Here, I’m exploring ways to combine them more effectively to enhance efficiency.
This blog is to exploring the differences between using Python, Pandas and Power BI for data analysis
1.Comparsion in terms of data cleaning:
Power BI: Data Transformation: Power BI provides an intuitive data transformation tool called Power Query Editor. You can use it to clean, merge, and reshape data.
Python with Pandas: Data Manipulation: Python, especially when combined with the Pandas library, offers powerful data manipulation capabilities. You can write custom scripts to automate repetitive tasks like removing missing values or correcting date formats.
Example Task compared in both Python, pandas VS Power BI - - - - - ->>
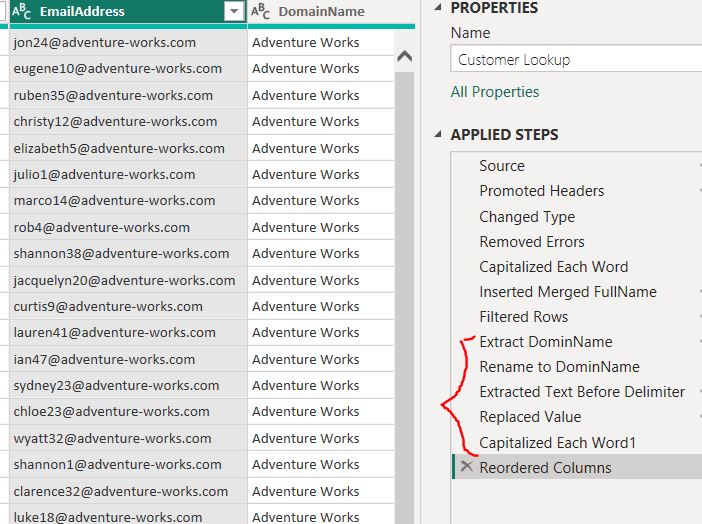
Example 1 : To extract the domin name from following column named email address:
1.Duplicate the Email Column: In the Power Query Editor, locate the column containing email addresses. Right-click on the column header and choose “Duplicate Column.”
2.Split the Column by Delimiter '@': Select the duplicated email column. Go to the “Transform” tab. Click on “Split Column” and choose “By Delimiter.” Specify “@” as the delimiter.
3.Split the same Column by Delimiter '.': Select the same column above. Go to the “Transform” tab. Click on “Split Column” and choose “By Delimiter.” Specify “.” as the delimiter.
4.Replace value '-' by space ' ': Select the same column above. Go to the “Transform” tab. Click on “Replace Values” and choose Replace value '-' by space ' '
5.Rename the Remaining Column: Double-click on the remaining column header (containing the domain part). Rename it to something like “Email Domain.”
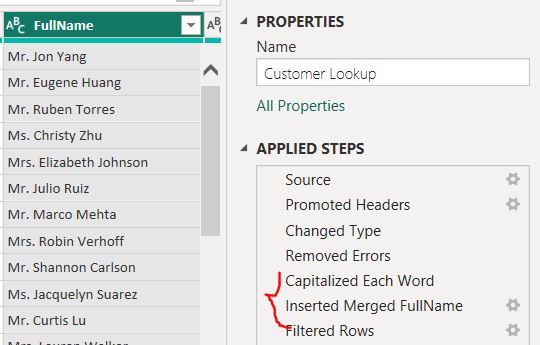
Example 2 : To concatenate the value from ‘Prefix’, ‘FirstName’, ‘LastName’ to form a new column called ‘FullName’:
1 2 3 4 5 6 7 8 9
Prefix FirstName LastName 0 MR. JON YANG 1 MR. EUGENE HUANG 2 MR. RUBEN TORRES 3 MS. CHRISTY ZHU 4 MRS. ELIZABETH JOHNSON ... ... ... ... 18153 NaN NaN NaN 18154 rows × 3 columns
>> result -> FullName 0 Mr. Jon Yang 1 Mr. Eugene Huang 2 Mr. Ruben Torres 3 Ms. Christy Zhu 4 Mrs. Elizabeth Johnson ... 18153 Nan Nan Nan Length: 18154, dtype: object
Using Power BI:
1 2 3 4 5 6 7 8 9 10 11 12 13 14
1.Duplicate the Column:
    Open your Power Query Editor.
    Locate the column containing the name components (e.g., Prefix, FirstName, LastName).
    Shift + Left-click on the columns to concate (e.g., Prefix, FirstName, LastName).

2.Combine Columns:
    Go to the “Transform” tab.
    Click on “Merge Columns” and choose Space”
    Type new column name "FullName".

3.Format Columns:
    Go to the “Transform” tab.
    Click on “Format” and choose “Capitalize Each Word”.
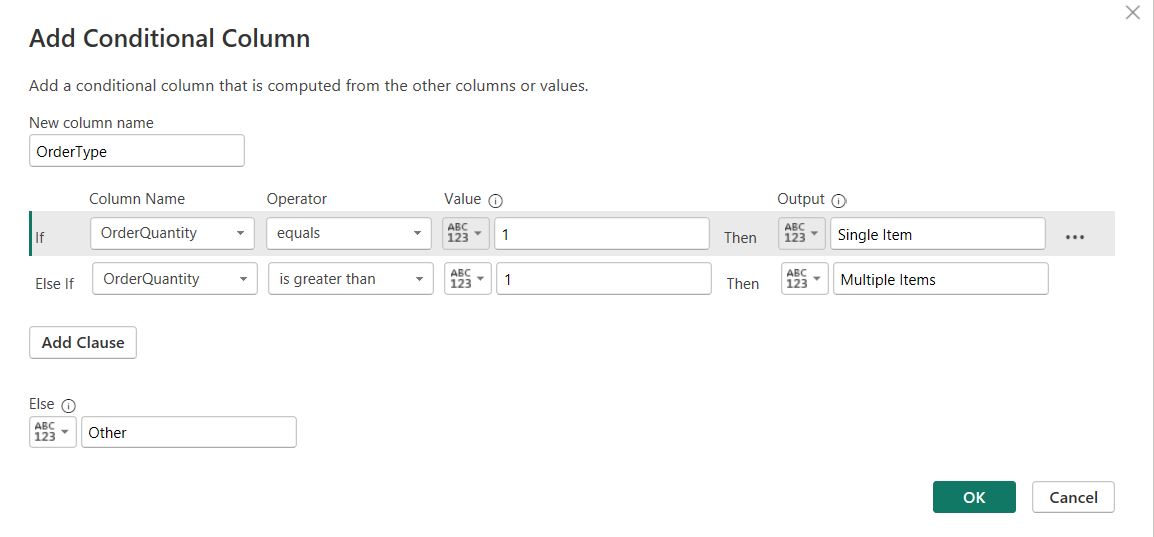
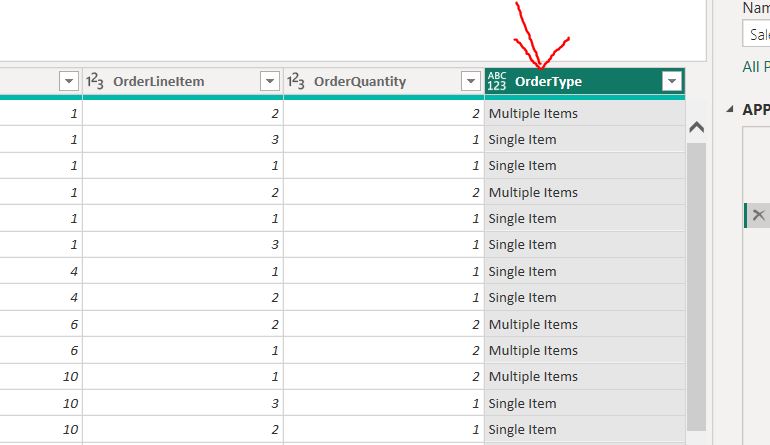
Example 3 : To categorize the order type for each item in an order based on predefined criteria:
>> sales2022Lookup['OrderQuantity']\ .apply(lambda x: 'Single item'if x == 1else'Multiple Items')
>> result -> 0 Multiple Items 1 Single item 2 Single item 3 Multiple Items 4 Single item ... 29476 Multiple Items 29477 Single item 29478 Single item 29479 Multiple Items 29480 Multiple Items Name: OrderQuantity, Length: 29481, dtype: object
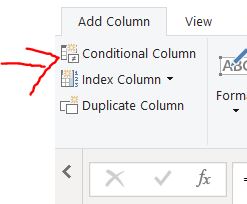
Using Power BI:
1
1. Select the 'OrderQuantity' column, then click following:
Summary of Comparsion:
In terms of processing speed, Python and Pandas can swiftly handle large datasets, often returning results in a split second. On the other hand, Power BI tends to take a bit longer sometimes more time to achieve the same results. Additionally, data cleaning in Power BI involves several manual steps (if you don’t know M code or DAX), requiring clicks within the interface. In contrast, Python allows you to accomplish the same tasks with just a few lines of code (though one has to know programming and regex etc.).
However, from an employer’s perspective, the training cost and process for Power BI are more straightforward and cost-effective compared to training a programmer. But AI has come to rescue.