PowerBI - Notes - Part 4 - CSV Loading Issue Create Extra Rows


How to Fix the Issue of Extra Rows of Bad Data being created When Loading a Folder of CSV Files into Power BI:

Recently, I encountered an issue while working on a data project that involved loading millions of rows of data from a folder of CSV files into Power BI. During the process, I noticed that extra rows, which did not exist in the original files, were being generated. Here are the details (this is a demo project, and all sensitive information has been removed for confidentiality):

Testing with a Single CSV File

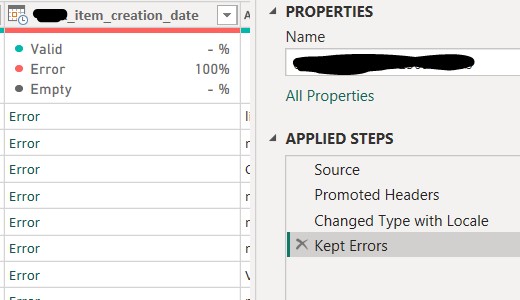
To troubleshoot and demonstrate the issue quickly, I started by testing with a single CSV file. Upon loading this file into Power BI, I noticed an error in the “Creation_date” column. The error affected less than 1% of the rows, showing an “Error” message in that column.

Initially, I assumed it was a common issue with formatting datetime values in Power BI. To resolve it, I attempted the three standard methods for converting the column to a datetime format. However, the error persisted despite these efforts.


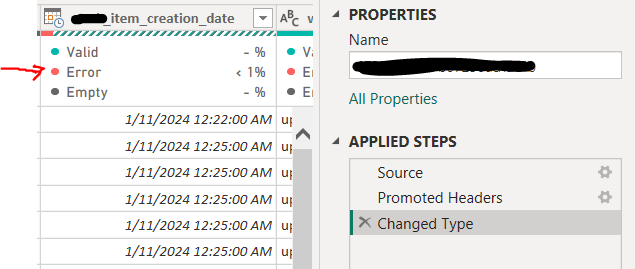
Then, I filtered the column to display only the rows with "Error," but this didn't provide much insight into the root cause of the issue.

Read More

PowerBI - Notes - Part 3 - DAX Code

This post is keeping some notes regarding useful DAX code.

DAX code

DAX, or Data Analysis Expressions, is a collection of functions, operators, and constants that can be used in formulas or expressions to calculate and return one or more values. It is designed to work specifically with Power BI, Power Pivot, and Analysis Services.

DAX can introduce the following 2 results:

1.Calculated_Columns

  1. -Values are calculated based on info from each row of table;
  2. -Appends static values to each row in a table (new column which increase file size);
  3. -Primarily used for filtering data in reports;

2.Meatures_Columns

  1. -Valuese are calcualted based on info from any filters in the report(filter context);
  2. -No new column is created or added to the file (not increase file size);
  3. -Primarily used for aggregating values in report visual;

General_Method:

Read More

PowerBI - Notes - Part 2 - Filter Context & Flow

This post is trying to explain the concepts of Filter Context and Flow.

Flow of Filter Context

The flow of filter context describes how filters are applied and propagate through relationships in a data model. When a filter is applied to one table, it can affect other tables through established relationships, based on the direction and type of relationship (one-to-many, many-to-one, bidirectional).

S1 - Understanding the following models’ flow of relationships:

1.The flow direciton from the one side (1) of the relationship to the many side (*).
2.The following Red arrows show the filter direction, when filter a table that filter context is passed to 
any related "downstream" tables, following the arrow's direction. 
3.Filter context CANNOT flow "upstream".

Using the following two tables, we can create a summarized table. For example, we aim to generate summarized sales data of products for each continent, categorized by color.

Read More

PowerBI - Notes - Part 1

This post contains useful notes for using PowerBI Desktop. I’ve compiled numerous helpful tips for future reference on how to query and transform data.

Some useful methods for data query and transformation

- M code to generate a list of dates in the Query Editor:

S1 - Click following “Blank Query” to create a new Query:

S2 - Click following “Advanced Editor” to bring up the Editor Window:

S3 - Following code would generate the table of list of dates starting from 1 Jan 2023:

Code –>>:

Read More

Data Reveals - Seasonal Patterns in the Equity Market - Is the ‘Sell in May and Go Away, Come Back in September’ Strategy Reliable?

Throughout my career in finance, I’ve frequently encountered discussions and readings about seasonal patterns in the U.S. equity market. Consequently, I’ve been inspired to conduct my own analysis to determine if these patterns remain relevant today. This blog delves into the application of data analysis technologies, including Python, Pandas, and Jupyter Notebook, to investigate potential seasonal patterns in the stock market, such as the ‘Sell in May and go away, but remember to come back in September’ phenomenon. For the detailed project, please refer to the link on GitHub.

The saying ‘Sell in May and go away, but remember to come back in September’ is a well-known financial proverb. It suggests that the market’s performance is typically weaker in the six-month period between May and October. To test the validity of this maxim, I analyzed the price data of IVV.US (iShares Core S&P 500 ETF) from 2000 to 2024. This ETF closely tracks the investment results of the S&P 500 index, composed of large-capitalization U.S. equities.

Close prices for each year from 2000 to 2024

NOTE: The dotted vertical line indicates the lowest price of that year. (IVV started trading on May 2000)

Read More

Python & Pandas VS Power BI for Data Cleaning

To start, I’m using both of these tools and thoroughly enjoying them. Here, I’m exploring ways to combine them more effectively to enhance efficiency.

This blog is to exploring the differences between using Python, Pandas and Power BI for data analysis

1.Comparsion in terms of data cleaning:

Power BI:
Data Transformation: Power BI provides an intuitive data transformation tool called Power Query Editor. You can use it to clean, merge, and reshape data.

Python with Pandas:
Data Manipulation: Python, especially when combined with the Pandas library, offers powerful data manipulation capabilities. You can write custom scripts to automate repetitive tasks like removing missing values or correcting date formats.

Example Task compared in both Python, pandas VS Power BI - - - - - ->>

Example 1 : To extract the domin name from following column named email address:

1
2
3
4
5
6
7
8
9
10
11
12
0          jon24@adventure-works.com
1 eugene10@adventure-works.com
2 ruben35@adventure-works.com
3 christy12@adventure-works.com
4 elizabeth5@adventure-works.com
5 julio1@adventure-works.com
6 marco14@adventure-works.com
7 rob4@adventure-works.com
8 shannon38@adventure-works.com
9 jacquelyn20@adventure-works.com
......
Name: EmailAddress, Length: 18154, dtype: object

Using Python & Pandas:

1
2
3
4
5
6
7
8
9
10
11
12
13
14
>> df['EmailAddress']\
.str.split(r'@|\.', expand=True)[1]\
.str.replace('-',' ')\
.str.title()

>> result ->

0 Adventure Works
1 Adventure Works
2 Adventure Works
3 Adventure Works
4 Adventure Works
...
Name: 1, Length: 18154, dtype: object

Read More

Spring Framework - JPA, Hibernate and JDBC

This post outlines the difference between JPA, Hibernate and JDBC. They are essential to know to work with database in Spring Framework and Springboot projects.

JPA (Java Persistence API):
JPA is a Java specification that defines an object-relational mapping standard for Java applications. It provides a higher-level abstraction over JDBC, but defines a set of interfaces and classes that ORM frameworks like Hibernate can implement. JPA introduces a set of annotations and a query language (JPQL) that developers can use to map Java objects to database tables and execute queries.

Hibernate:
Hibernate is an Object-Relational Mapping (ORM) framework for Java that simplifies the interaction between Java applications and relational databases by implementing JPA specifications and concepts. It provides a higher-level abstraction over JDBC, allowing developers to work with Java objects instead of directly writing SQL queries. Hibernate maps Java classes to database tables and automatically handles tasks like generating SQL queries, executing them, and mapping result sets back to Java objects.

Read More